Getting started with Lighthouse

The way users experience your website may directly impact relevant ecommerce metrics, such as user session time and sales conversion rate. In this scenario, adopting the right tools and strategies to comprehend how shoppers perceive and interact with your website is of utmost importance. One of the most cutting-edge tools you can currently use to assess how well your website performs from the user's point of view is Google Lighthouse.
In this article, you will learn how Google Lighthouse works and how you can use it to optimize your website.
What is Lighthouse?
Lighthouse is a free, open-source tool developed by Google that identifies issues and provides insights into a web page's performance, usability, and overall quality.
Lighthouse audits the URL of a web app and generates multiple reports detailing how the page performs according to web standards and developers' best practices.
It's important to keep in mind that you may not receive such high scores on your first audit. You may need to use previous reports to fix and improve the quality of your pages iteratively. This is the primary value of Lighthouse: to help developers identify and tackle common issues affecting a page's quality.
Lighthouse audits are grouped into five categories:
- Performance - Evaluates how users perceive and experience a web page by testing key Web Metrics.
- Accessibility - Evaluates the page usability for people with disabilities or impairments.
- SEO - Checks if the page is optimized for search engine results ranking.
- Progressive web apps - Validates the aspects of a Progressive Web App, checking whether a full application-like experience is offered.
- Best practices - Evaluates the overall code health of a webpage. It also runs checks on best practices for modern web development, most of which are related to security aspects.
Users can select one, multiple or all five categories, depending on which aspects of their website they want to test.
How to run Lighthouse audits?
There are different ways to conduct a Lighthouse audit: from PageSpeed Insights, in Chrome DevTools, from the command line, or via a Chrome extension.
However, if you use WebOps along with FastStore, you can avoid running manual audits for your web pages as, for every deploy and deploy preview, WebOps automatically provides Lighthouse reports on GitHub logs and Pull Requests (PRs).
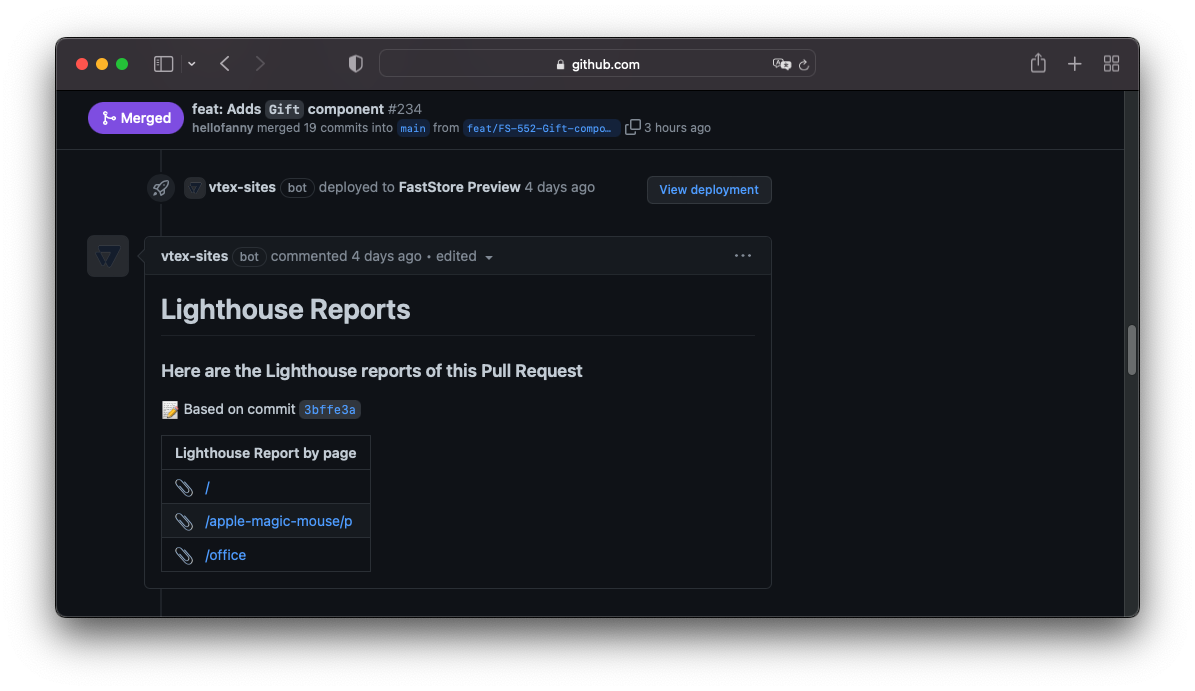
Checking these reports will help you keep track of how each PR affects your store's performance, SEO, and accessibility.
To enable Lighthouse reports from WebOps, you must set up the Lighthouse CI section of the store.config.js file with paths to the Home page, a Product Details Page (PDP), and a Collection page.
// Lighthouse CI
lighthouse: {
  server: process.env.BASE_SITE_URL || 'http://localhost:3000',
  pages: {
    home: '/',
    pdp: '/apple-magic-mouse/p',
    collection: '/office',
  },
},
How to audit a complete website?
Notice that, even though Lighthouse is a powerful tool for inspecting web page quality, Lighthouse can only run at a URL level. Hence, we strongly recommend that you test at least the Home page, a Product Details Page (PDP), and a Collection page of your store.
Performance Audit
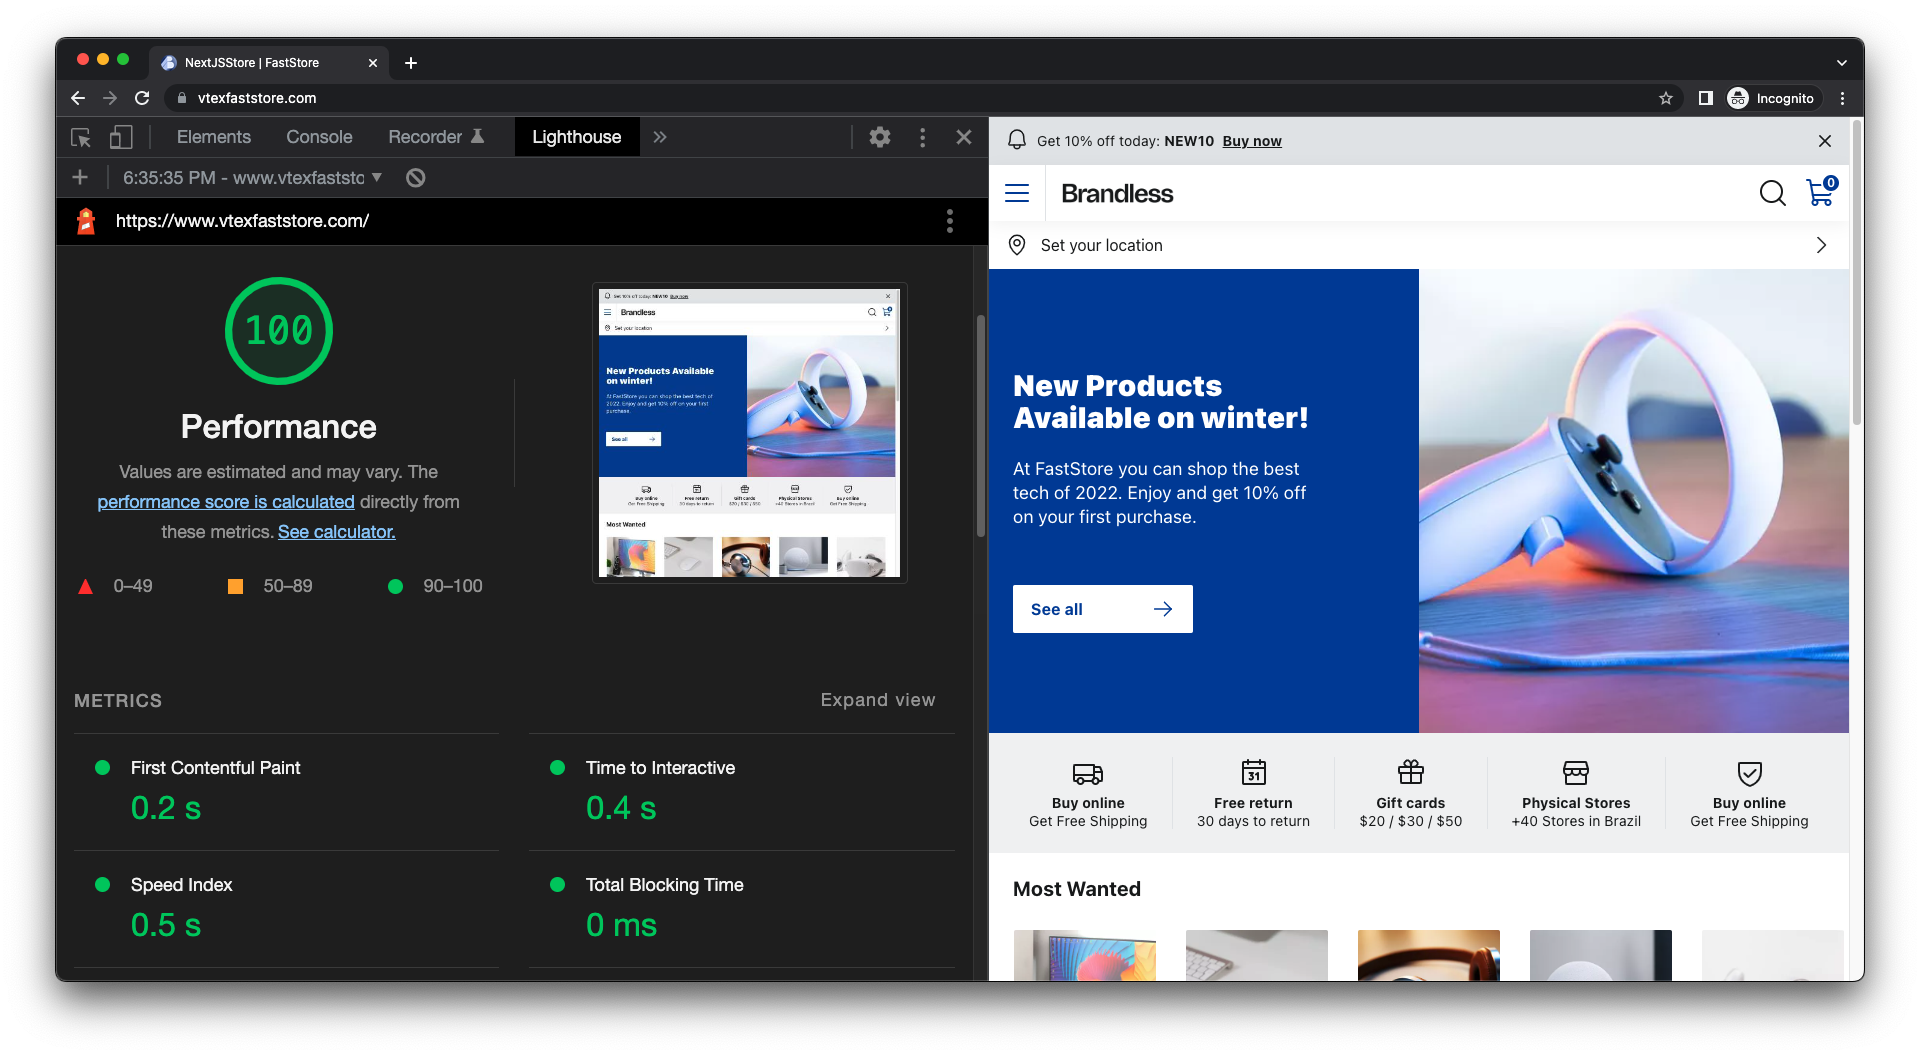
When you submit a URL to Lighthouse to audit your web page performance, Lighthouse creates a report with the following information:
- Performance Score and Metrics - a weighted average of the Metrics scores and the results of independent metrics that aim to represent the user's perception of performance.
- Opportunities - suggestions and documentation on how to make the page load faster with estimated potential savings.
- Diagnostics - additional guidance that developers can explore to further improve their pages' performance.
- Passed audits - Opportunities and Diagnostics suggestions that have already been implemented on the page.
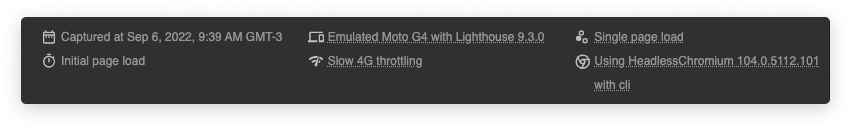
- Additional information - details about the sampled data, including the data collection period, devices used for emulation, chrome version, etc.
In general, only Metrics — not the outcomes of Opportunities and Diagnostics — affect the overall Performance Score. However, there is an indirect relationship because implementing Opportunities and Diagnostics suggestions will likely also improve the Metric scores.
Performance Score and Metrics
The Lighthouse Performance Score provides an estimated representation of users' perception of performance. Even if, for a computer, performance could be better described as the time it takes for the whole page to load, this specific metric may not necessarily correspond to anything the user cares about. From the user's point of view, performance is a perception of how he experiences page loading and how responsive a page feels. To help ensure that Lighthouse metrics are relevant to users, they are structured around a few key questions:
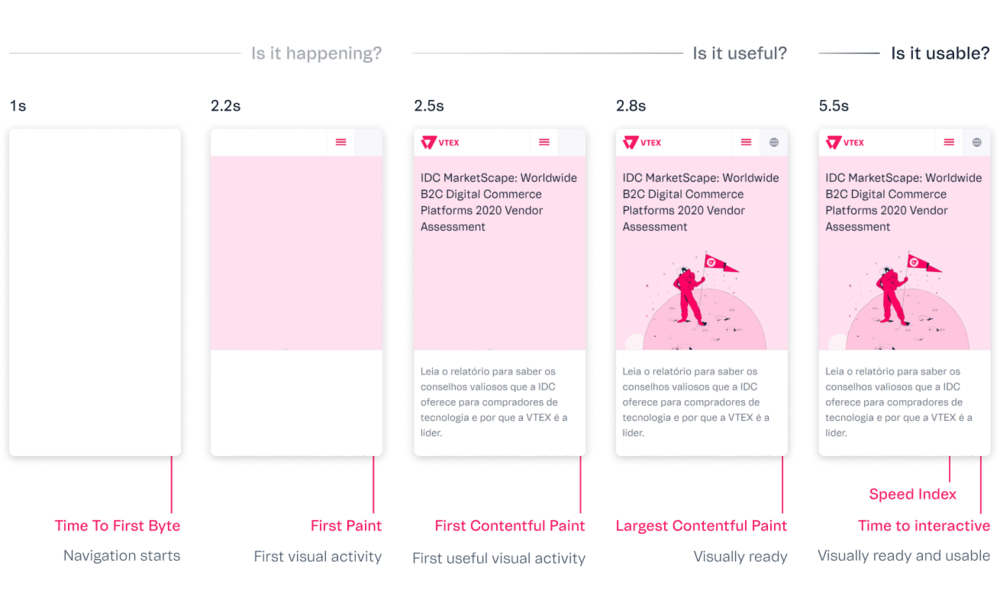
- Is it happening? When the first visual activities occur, and the user notices that the page is loading. If the server doesn't respond quickly, the user may feel that there’s a problem and leave the page.
- Is it useful? When there's enough valuable content rendered. This moment is capable of keeping the user engaged.
- Is it usable? When the UI seems ready for interaction. This moment can be frustrating if users try to interact with the visible content, but the page is still busy.
- Is it delightful? The moment after loading that guarantees smooth and free-of-lag interactions.
Given these four moments during the page load journey, a series of individual metrics were created, considering what could be relevant for users in each of these moments, such as the time taken for the first contentful paint to be displayed and for the page to become interactive. A weighted average of these metrics determines the final Lighthouse Performance Score:
| Audit | Weight |
|---|---|
| Total Blocking Time (TBT) | 30% |
| Largest Contentful Paint (LCP) | 25% |
| Cumulative Layout Shift (CLS) | 15% |
| First Contentful Paint (FCP) | 10% |
| Speed Index (SI) | 10% |
| Time to Interactive (TTI) | 10% |
Each of these metrics is briefly explained in the following sections. Notice that the Total Blocking Time and Largest Contentful Paint have higher weights and, consequently, a greater impact on the overall Performance Score. Therefore, paying close attention to these two metrics is paramount.
Due to frequent adjustments to Google's ranking formula, the overall Performance Score may vary over time. To stay up to date with Lighthouse's latest updates, we recommend visiting web.dev - a Google site that provides guidance on modern web development.
When running Lighthouse, you'll notice that the metrics results obey a color code according to the following ranges:
| Code | Meaning | Range |
|---|---|---|
| ▲ | Poor | 0-49 |
| ■ | Needs improvement | 50-89 |
| ● | Good | 90-100 |
Total Blocking Time (TBT) | 30%
The Total Blocking Time is the amount of time between the First Contentful Paint (FCP) and Time to Interactive (TTI) during which user inputs, such as mouse clicks, screen taps, or keyboard presses, are blocked. When a page has a long TBT, the user may notice the delay and perceive the page as sluggish.
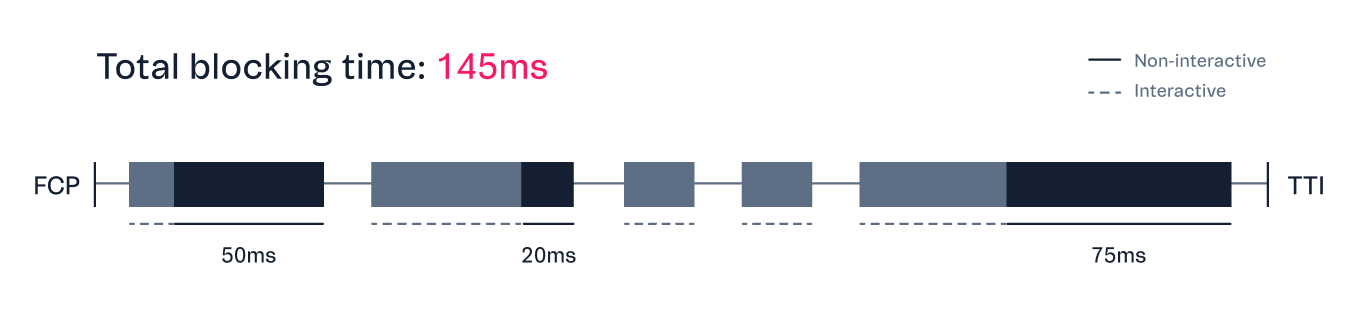
User interaction is blocked when a long task blocks the main thread and impedes the browser from responding to other requests. The blocking time starts to be counted after 50ms. For example, if a function takes 150ms to execute, the blocking time is 100ms. Hence, in other words, the Total Blocking Time of a page is the sum of the blocking time of each long task that occurs during page load.
Check in the following how Lighthouse classifies TBT times:
| TBT time (milliseconds) | Color-coding |
|---|---|
| Over 600 | ▲ Poor |
| 200 - 600 | ■ Needs improvement |
| 0 - 200 | ● Good |
TBT is mainly affected by JavaScript and third-party scripts parsing and execution. Besides removing or reducing JavaScript code, it's possible to improve TBT by splitting long tasks into smaller ones, improving code efficiency, and implementing lazy loading.
For information on how to improve TBT, please refer to Google's guidelines.
First Contentful Paint (FCP) | 10%
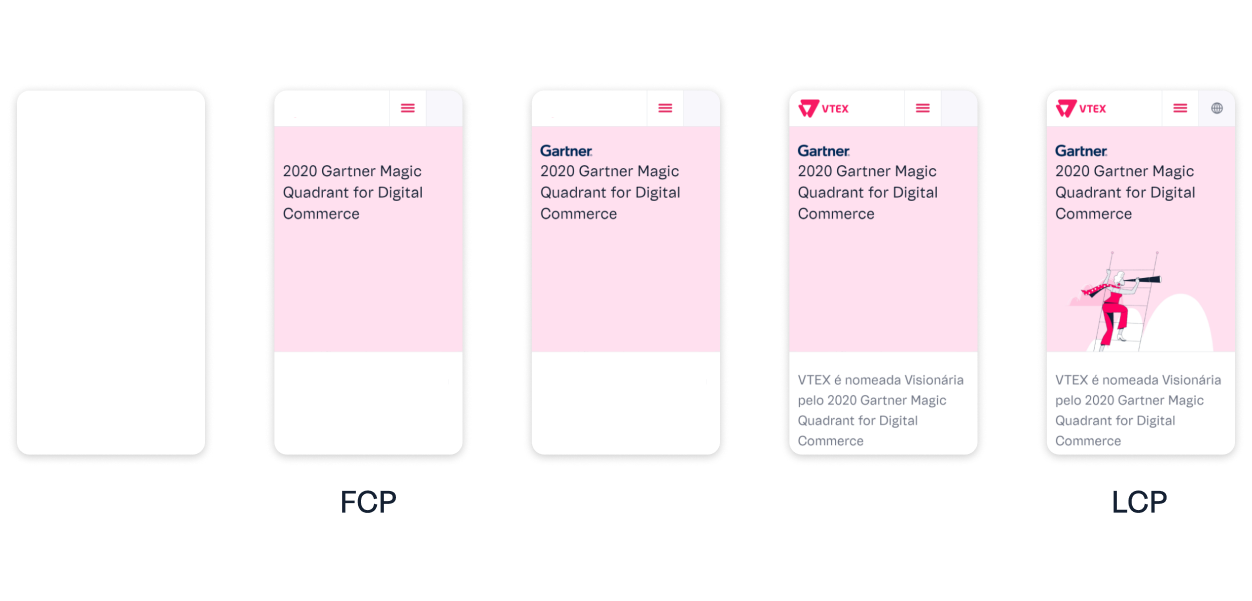
First Contentful Paint measures the time it takes for the browser to render the first bit of content from the DOM. Short FCP times mean fast visual activity from the browser. They reassure the user that something is happening during the page load and, therefore, are more likely to keep users engaged.
Check in the following how Lighthouse classifies FCP times:
| FCP time (seconds) | Color-coding |
|---|---|
| Over 3 | ▲ Poor |
| 1.8-3 | ■ Needs improvement |
| 0-1.8 | ● Good |
The FCP affects most of the other metrics and serves as a huge red flag if it's taking too long. This metric can be affected by:
- Long server response times.
- Render-blocking resources, such as CSS stylesheets, font files, and JavaScript scripts.
- Script-based elements above the fold.
- Large DOM trees.
- Multiple 301 redirects.
For information on how to improve FCP, please refer to Google's guidelines.
Largest Contentful Paint (LCP) | 25%
Largest Contentful Paint measures the time it takes to render the largest visible element of the page within the viewport. Fast LCPs help reassure the user that the page is useful.
| LCP time (seconds) | Color-coding |
|---|---|
| Over 4 | ▲ Poor |
| 2.5-4 | ■ Needs improvement |
| 0-2.5 | ● Good |
The metric only considers the loading time of elements significantly relevant to the user experience, such as:
<img>elements,<image>elements inside an<svg>element.<video>elements.- Elements with a background image loaded via the
url()function. - Block-level elements, such as
<h1>,<h2>,<div>,<ul>,<table>, etc.
LCP is primarily affected by the following factors:
- Long server response times.
- Render-blocking resources, such as CSS stylesheets, font files, and JavaScript scripts.
- Resource size and load time.
- Client-side rendering.
For information on how to improve LCP, please refer to Google's guidelines.
Speed Index (SI) | 10%
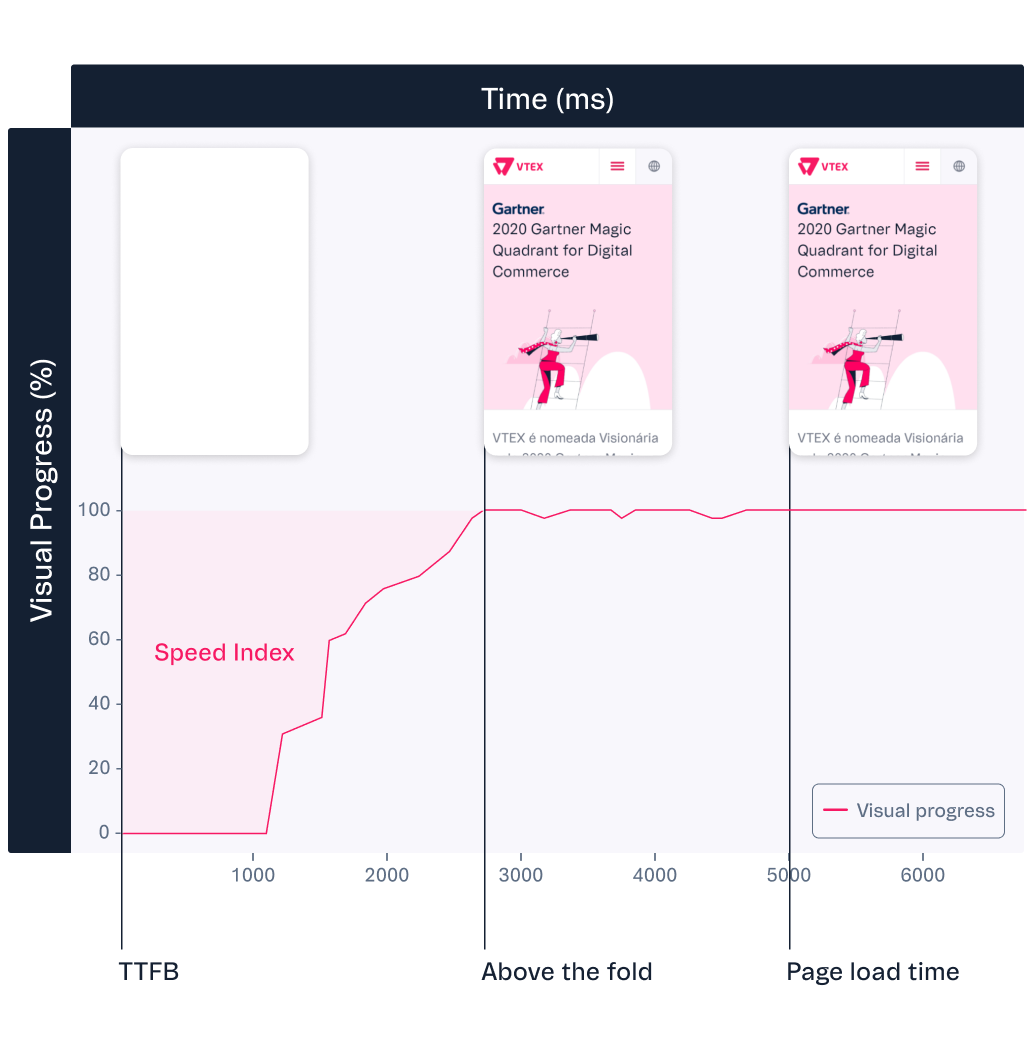
The Speed Index indicates how quickly the elements of a page become visible in the viewport. The Speed Index is a synthetic value that computes the visual differences between frames captured during the page load. Until all content is visible, each frame is scored considering its visual completeness. The individual scores are then summed up to give the page's Speed Index.
Check how Lighthouse classifies SI times:
| SI time (seconds) | Color-coding |
|---|---|
| 0ver 5.8 | ▲ Poor |
| 3.4-5.8 | ■ Needs improvement |
| 0-3.4 | ● Good |
You can think of the Speed Index as a unified metric that considers many other metrics and audits, which can help you figure out whether your page speed optimizations are working. Generally speaking, most improvements to your page's First Contentful Paint and Largest Contentful Paint are also likely to improve the Speed Index.
For information on how to improve SI, please refer to Google's guidelines.
Time to Interactive (TTI) | 10%
Time to Interactive measures the time it takes for the page to become fully interactive and capable of responding to user inputs. Slow TTIs may make users feel frustrated and likely to leave your webpage.
A page is considered fully interactive when:
- The page displays useful content, such as the FCP. Having a huge gap between a visually complete page and a usable one can impact the user experience a lot.
- Event handlers are registered for most visible page elements. If event handlers aren’t registered, the page won’t respond to user inputs. This may make users think the page is unresponsive or broken.
- The page responds to user interactions within 50 milliseconds. Long Tasks (tasks that execute for longer than 50ms) can block the main thread, delaying the page response to the user input.
The TTI happens 5 seconds after the last long task ends. If there aren't any long tasks, TTI happens after the FCP. Check in the following how Lighthouse classifies TTI times:
| TTI time (seconds) | Color-coding |
|---|---|
| Over 7.3 | ▲ Poor |
| 3.9-7.3 | ■ Needs improvement |
| 0-3.8 | ● Good |
Large TTIs are mostly caused by JavaScript code and third-party scripts that block the main thread, as well as by large images and CSS files, which delay the loading time of JS scripts.
TBT and TTI complement one another since they both offer insights into how responsively a page is to user activity.
For information on how to improve TTI, please refer to Google's guidelines.
Cumulative Layout Shift (CLS) | 15%
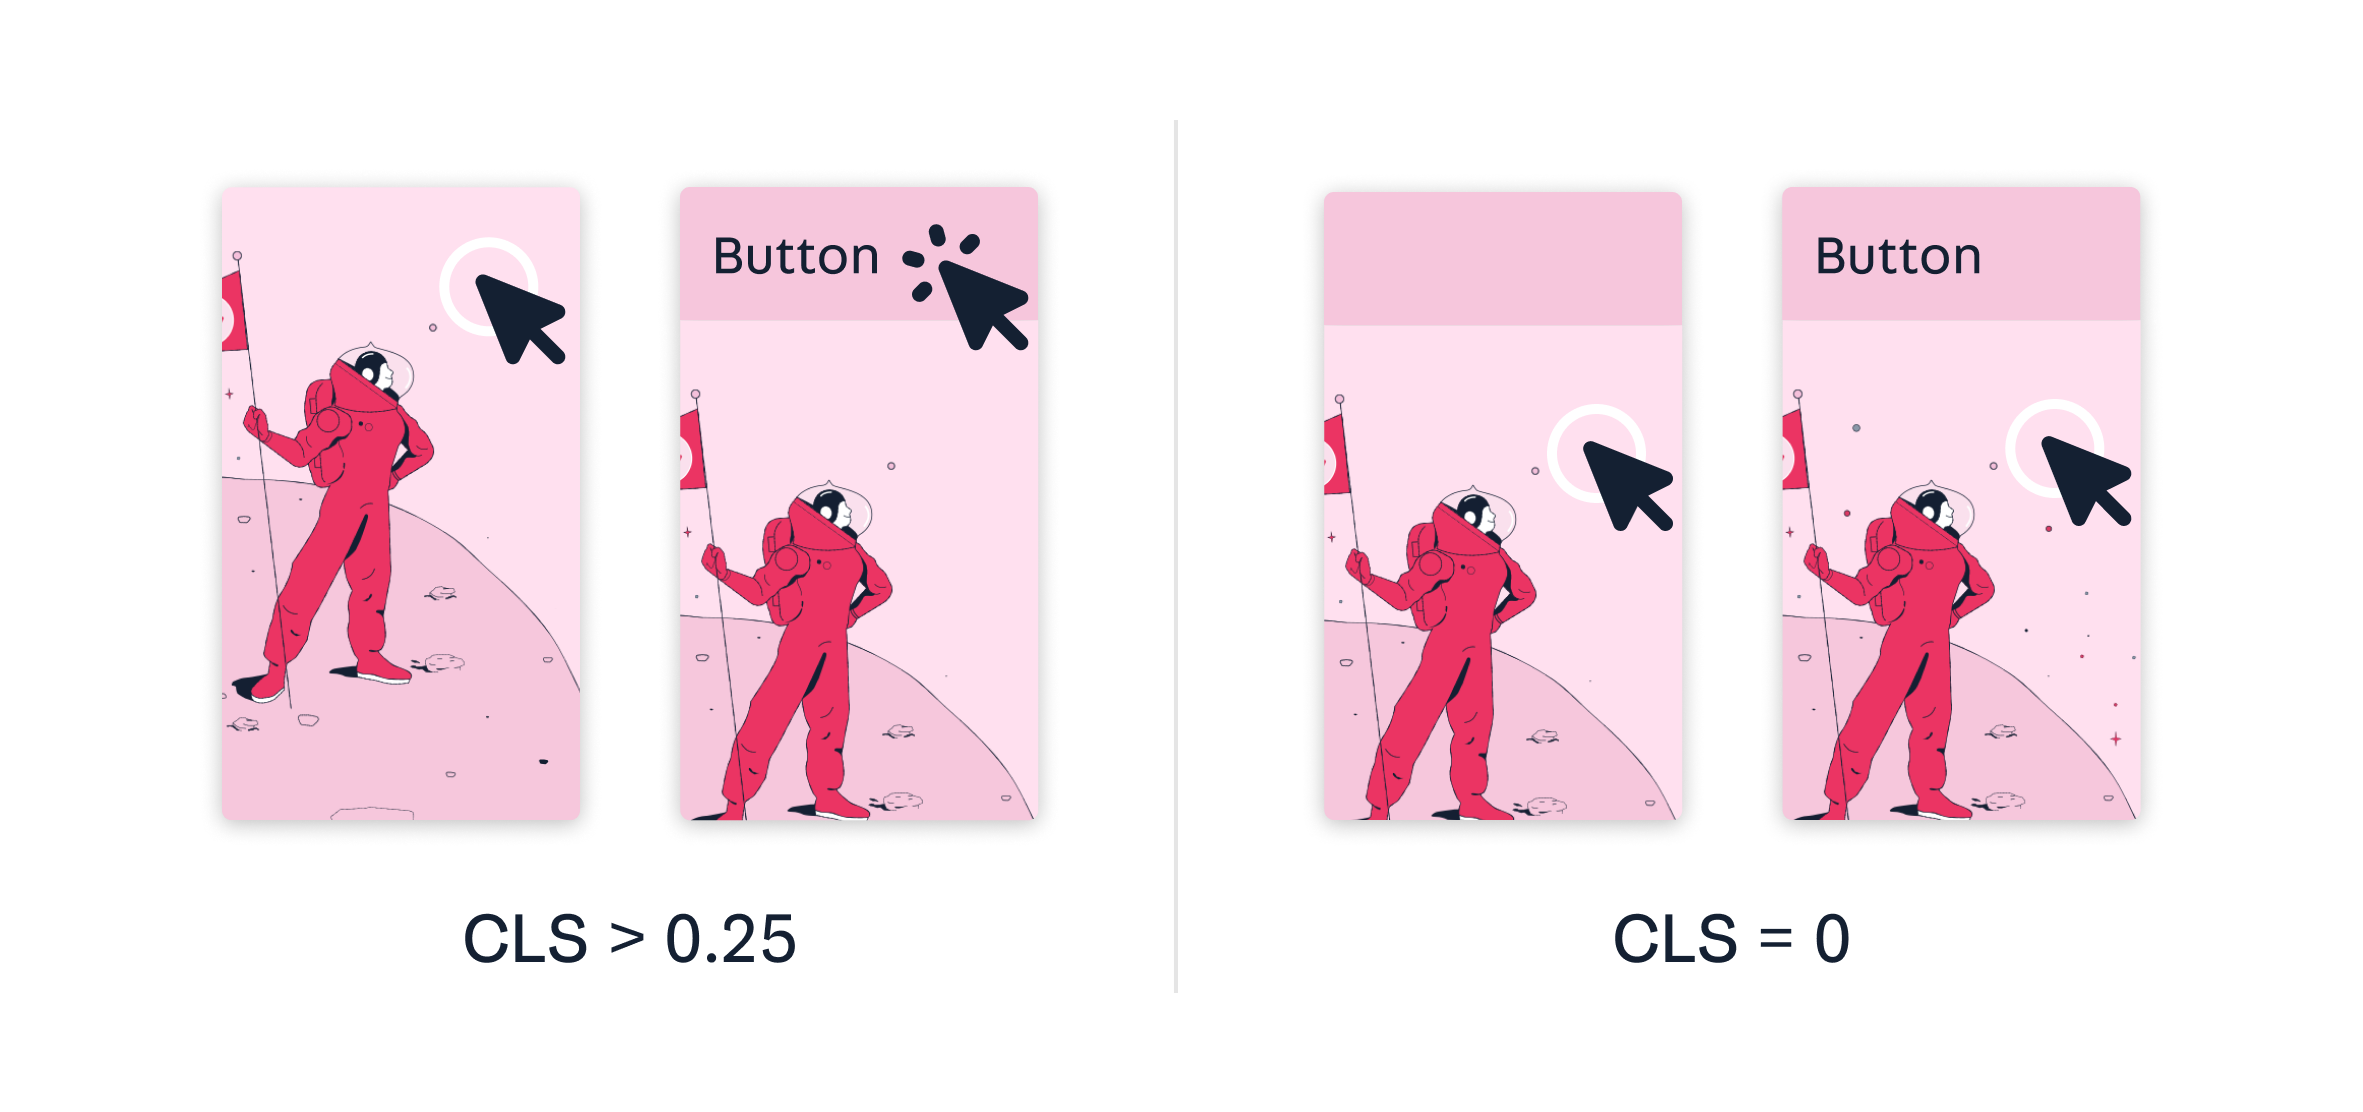
The Cumulative Layout Shift metric measures the impact of undesired content shifts that occur during the entire lifespan of a page.
A layout shift occurs when a visible element changes its initial position from one rendered frame to the next. A website with a low CLS has a steady page display without any elements shifting around. High CLSs may annoy users and affect how they interact with the page, causing them to click an unwanted button or link, for example.
| CLS | Color-coding |
|---|---|
| Over 0.25 | ▲ Poor |
| 0.1 - 0.25 | ■ Needs improvement |
| 0 - 0.1 | ● Good |
This metric is mostly affected by images, ads, embeds, and iframes without pre-defined dimensions, and by content dynamically inserted by JavaScript on the client side (e.g., a bar that suddenly appears on the header).
For information on how to improve CLS, please refer to Google's guidelines.
Opportunities
The Opportunities section provides insights that could potentially help your page load faster. The priority level of each opportunity is denoted by the same color coding used for the metrics. High priorities are indicated by red triangles, medium priorities by orange squares, and low priorities by gray circles.
Use the Opportunities section to determine which improvements will benefit your page the most. The more significant the opportunity, the more likely it will affect your Performance Score.
Click each opportunity to get more detailed information and documentation on how to fix the related issues. Also, notice that, unless you have a specific reason for focusing on a particular metric, it's usually better to focus on improving your overall Performance Score.
Diagnostics
The Diagnostics section provides more information about the performance of your application. It indicates the largest contentful paint element of your page, lists the longest tasks on the main thread and displays the cache lifetime, among other useful details. Once again, the details presented in this section do not directly affect the Performance Score but are likely to improve the metric values if taken into consideration.
Passed audits
The Passed audits section lists all the audits that the page passed. Once you implement Opportunities and Diagnostics suggestions, you can retest your page and check if they appear in the Passed Audits section.
Additional information
The Additional information section shares the following details about the sampled data:
- Data collection period
- Visit durations
- Devices
- Network connections
- Sample size
- Chrome version